VSP on tweet
Introduction
This is a hands-on example of vsp library. A sampled twitter data-set of tweets under #coronavirus was used for demonstration.
Methods
Libraries
Required libraries are dplyr, vsp, tidytext, purrr, and blogdown. The latter can be installed through devtools.
#load libraries
library(dplyr)
#devtools::install_github("RoheLab/vsp")
library(vsp)
library(tidytext)
library(purrr)#for map function
library(blogdown)#for shortcodes in rmarkdown
Data Source & Data description
Tweets were collected from Twitter API, and the twitter accounts were further divided into flocks, which is same as the murmuration website. The data-set can be downloaded from here. Here we name the data-set “covid”.
Data description:
- Date: YYYY/MM/DD. The data was collected from Feb 1st to March 31st.
- user_id: the id of the user that tweeted
- status_id: the id of the tweet post
- screen_name: the @name that is shown to the public. eg. @realdonaldtrump’s screen name is realdonaldtrump.
- flock_category: indicates the category of account clusters. There are 6 categories: liberals, conservatives, media, issue-centric, pop culture, academia
#top several lines of the data-set
head(covid)
## # A tibble: 6 x 6
## date status_id user_id screen_name text flock_category
## <date> <chr> <chr> <chr> <chr> <fct>
## 1 2020-02-01 1223721734… 32580016… BernieSande… "vermont sen. be… liberals
## 2 2020-02-01 1223649688… 15150904 techweenie "@amberd1116 @te… liberals
## 3 2020-02-01 1223647866… 87096872… tweets4poppy "tom's patriot c… conservatives
## 4 2020-02-01 1223719366… 89614375… CycleOfChaos "god bless this … conservatives
## 5 2020-02-01 1223584239… 93815260… HLAurora63 "@twitter @jack … conservatives
## 6 2020-02-01 1223611910… 87504275 rightlyalig… "wuhan doctors b… conservativesData Cleaning
- For convenience, split the data by flock, and store it as a list
covid_flockls<-split(covid,f=covid$flock_category)[1:6]- Extract the tweet text for each flock from the list generated by step 1
covid_textls<-lapply(covid_flockls,function(x){
    tibble(tweet=1:nrow(x), text=x$text)
})- Further, for each flock, unnest the tweet text into tokens
covid_ttls<-lapply(covid_textls, function(x){
    x %>% unnest_tokens(word, text)
})

#first several lines of the liberal flock, showing the word tokens in the #1 tweet
head(covid_ttls[['liberals']])
## # A tibble: 6 x 2
## tweet word
## <int> <chr>
## 1 1 vermont
## 2 1 sen
## 3 1 bernie
## 4 1 sanders
## 5 1 campaign
## 6 1 mayRun vsp
- Make sparse matrix for each flock
covid_matrix<-lapply(covid_ttls, function(x){
    dt<-cast_sparse(x,tweet,word)
})

#first 20 rows and columns of the liberal sparse matrix, 1 represents the ith and jth word appear together
covid_matrix[['liberals']][1:20,1:20]
## 20 x 20 sparse Matrix of class "dgCMatrix"
##
## 1 1 1 1 1 1 1 1 1 1 1 1 1 1 1 1 1 . . . .
## 2 . . . . . . . . . . 1 . . . . . 1 1 1 1
## 3 . . . . . . . . . . . . . 1 1 . . . . .
## 4 . . . . . . 1 . 1 . 1 . . 1 1 . . . . .
## 5 . . . . . . . . . . 1 . . 1 1 . . . . .
## 6 . . . . . . . . . . 1 . . 1 1 . . . . .
## 7 . . . . . . . . . . 1 . . 1 1 . . . . .
## 8 . . . . . . . . . . 1 . . 1 1 . . . . .
## 9 . . . . . . . . . . . . . 1 1 . . . . .
## 10 . . . . . . . . . . 1 . . 1 1 . . . . .
## 11 . . . . . . . . . . . . . 1 1 . . . . .
## 12 . . . . . . 1 . . . 1 . . . . . . . . .
## 13 . . . . . . . . 1 . 1 . . . . . . . . .
## 14 . . . . . . . . . . 1 . 1 1 1 . . . . .
## 15 . . . . . . 1 . . . 1 . . 1 1 . . . . .
## 16 . . . . . . . . . . 1 . . . . . . . . .
## 17 . . . . . . 1 . . . 1 . . 1 1 . . . . .
## 18 . . . . . . . . . . . . 1 1 1 . . . . .
## 19 . . . . . . . . . . . 1 . 1 1 . . . . .
## 20 . . . . . . . . . . . . . 1 1 . . . . .- Run vsp on each flock(i.e. categorized tweets in each flock into 15 topics, k=15). We can use screeplot function to visualize the singular value.
covid_fa<-lapply(covid_matrix,function(x){
  fa<-vsp(x,k=15)
})
## Warning in n * d: NAs produced by integer overflow
## Warning in n * d: NAs produced by integer overflow
## Warning in n * d: NAs produced by integer overflow
## Warning in n * d: NAs produced by integer overflow
## Warning in n * d: NAs produced by integer overflow#screeplot for the liberals flock
screeplot(covid_fa[['liberals']])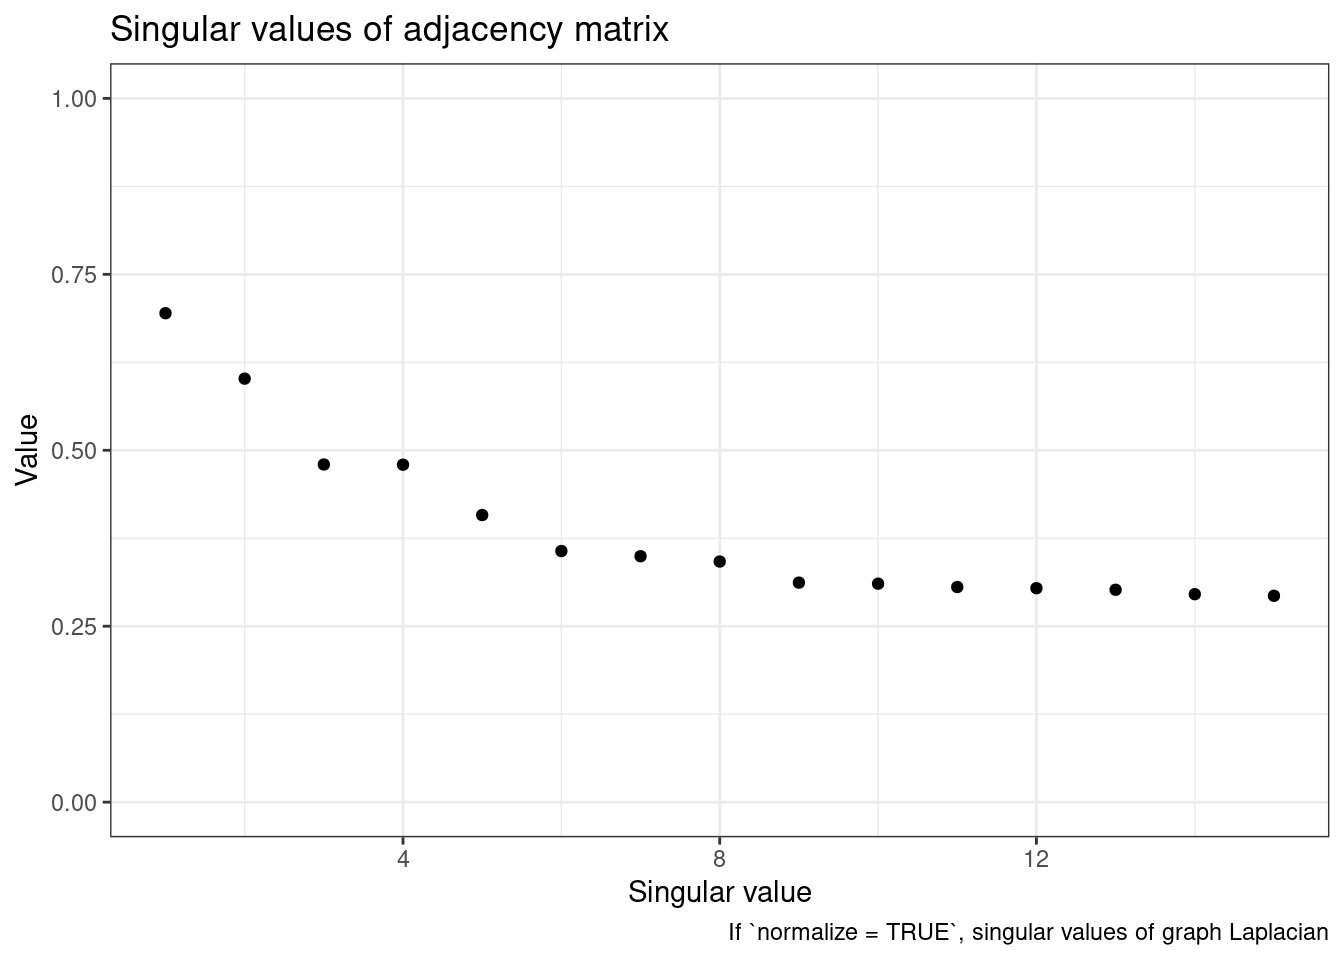
#use pair plot to plot the factors, serving as a diagnostic measure, here 1:5 means that plot the first 5 factors.
plot_varimax_z_pairs(covid_fa[['liberals']],1:5)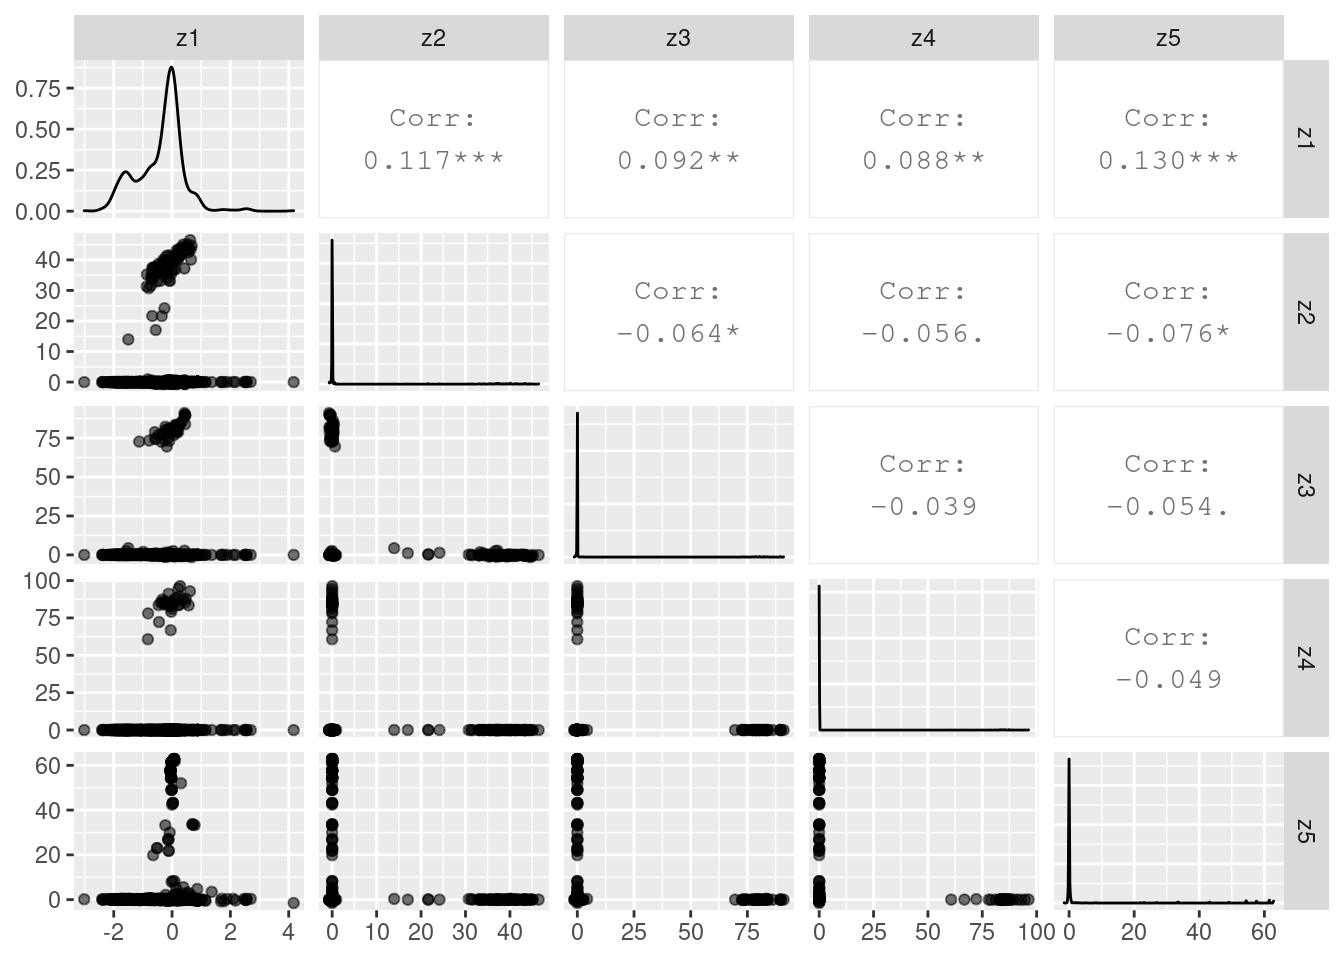
- For each flock, according to the vsp result, for each topic(i.e. column in the matrix), find the top 10 rows that have the highest score. (i.e. top 10 tweets that are most correlated with each topic, this will return the row index of the tweets, and we can use these indices to find the correspondent tweets from the tweet-by-flock data, which is the one from Data Cleaning/step1). The matrix Z is the one we will use. It shows how much tweet(row) i belongs to topic(column) j.
#find top 10 tweet ids
topTweets = 10
topid_ls<-lapply(covid_fa, function(x){
  topid<-x$Z %>% apply(2, function(t) which(rank(-t, ties.method = "random") <= topTweets))
})

#get the correspondent tweets
toptweet_ls<-lapply(seq_along(topid_ls), function(i){
  df<-topid_ls[[i]]
  txtdf<-covid_flockls[[i]]
  ls<-list()
  for(j in 1:ncol(df)){
    name<-paste("topic", j)
    ls[[j]]<-tibble(tweet = txtdf$text[df[,j]], status_id=txtdf$status_id[df[,j]],screen_name=txtdf$screen_name[df[,j]])
    names(ls)[j]<-name
  }
  return(ls)
})
#rename elements in toptweet_ls as flock names ("liberals","conservatives",...)
names(toptweet_ls)<-names(topid_ls)- if you want to embed the tweets into websites, you can mutate a column for tweet-post-urls. Or, if you are using short codes, you can skip this step and directly use status id to get the html widgets, just as step 5 shows.
#paste twitter link to each dataframe
#get_embed url of twitter post
get_embed <- function(status_id){
  api_result <- httr::GET(paste0(
    "https://publish.twitter.com/oembed?url=https%3A%2F%2Ftwitter.com%2FInterior%2Fstatus%2F",
    status_id))
  api_content <- httr::content(api_result)
  html_content <- api_content[["html"]]

  return(html_content)
}
toptweet_ls_withlink<-lapply(toptweet_ls,function(ls){
  lapply(ls, function(topic){
    topic%>%
      mutate(status_url=paste0("https://twitter.com/",screen_name,"/status/",status_id))%>%
      mutate(embed_url=map(status_id,get_embed))
  })
})
#example of top tweets for topic 10 in flock liberals
toptweet_ls_withlink[['liberals']][['topic 10']]
## # A tibble: 10 x 5
## tweet status_id screen_name status_url embed_url
## <chr> <chr> <chr> <chr> <list>
## 1 "🚨\U0001f9a0 local us… 1234184131… shawbear76 https://twitter.com… <chr [1]>
## 2 "\U0001f9a0🙏🏾 coronav… 1237756870… veterans_i https://twitter.com… <chr [1]>
## 3 "@rpdandy @veterans_i… 1238908617… shawbear76 https://twitter.com… <chr [1]>
## 4 "@rpdandy @veterans_i… 1238912196… shawbear76 https://twitter.com… <chr [1]>
## 5 "#lockherup 🤑👎🏽 @sena… 1240962315… veterans_i https://twitter.com… <chr [1]>
## 6 "😳🤬🤦🏽♀️ as the coron… 1243012974… shawbear76 https://twitter.com… <chr [1]>
## 7 "@haldonahue @birdieg… 1243278534… shawbear76 https://twitter.com… <chr [1]>
## 8 "😲\U0001f9a0 infant d… 1244075766… shawbear76 https://twitter.com… <chr [1]>
## 9 "😲\U0001f9a0 infant d… 1244077707… MeAShrew https://twitter.com… <chr [1]>
## 10 "🤭\U0001f9a0🙏🏾 cnn's … 1245022567… veterans_i https://twitter.com… <chr [1]>- Now, finally, let’s use short codes to display some of the twitter-post html widgets. Here is the example of tweets under flock liberals, topic 10.
shortcodes("tweet",toptweet_ls_withlink[['liberals']][['topic 10']]$status_id)🚨🦠 Local USPS employee tests positive for coronavirus https://t.co/dlGz20u49d @birdieglad @pannlewis44 @graceslick77 @haldonahue @GDijkhuyzen @veterans_i @DaOGTriple @DLTrunnell @Robin_Volpi @JhwilsH @flints1963 @asoldiersvoice @shawbear76 @1badshoehabit @RK1960 @JAMSRIDE
— Kelli Smith (@KelliSmith15) March 1, 2020
🦠🙏🏾 Coronavirus: Up to 70% of Germany could become infected @birdieglad @pannlewis44 @graceslick77 @GDijkhuyzen @haldonahue @MarilynT4 @veterans_i @DaOGTriple @DLTrunnell @Robin_Volpi @JhwilsH @flints1963 @asoldiersvoice @shawbear76 @RK1960 https://t.co/KQ2l0cCg6i
— Kelli Smith (@KelliSmith15) March 11, 2020
SLOPPY @RepChipRoy! 👿 HOW DARE U? 🤮 🦠 #CoronavirusBill 🥴🥊 @birdieglad @pannlewis44 @_palmae @graceslick77 @GDijkhuyzen @haldonahue @MarilynT4 @veterans_i @DaOGTriple @DLTrunnell @Robin_Volpi @JhwilsH @flints1963 @asoldiersvoice @shawbear76 @MzDivah67 @RK1960 @JAMSRIDE
— Kelli Smith (@KelliSmith15) March 14, 2020
DAMN U @RepAlexMooney! 🤮 A sham SHAME! 👿🦠 #CoronavirusBill 👻🤦🏽♀️☠️ @birdieglad @pannlewis44 @graceslick77 @GDijkhuyzen @haldonahue @MarilynT4 @veterans_i @DaOGTriple @DLTrunnell @Robin_Volpi @JhwilsH @flints1963 @asoldiersvoice @shawbear76 @MzDivah67 @1badshoehabit @RK1960
— Kelli Smith (@KelliSmith15) March 14, 2020
#LockHerUp 🤑👎🏽 @SenatorLoeffler 🤮dumped stocks after coronavirus meeting @birdieglad @pannlewis44 @graceslick77 @GDijkhuyzen @haldonahue @MarilynT4 @veterans_i @DaOGTriple @DLTrunnell @Robin_Volpi @JhwilsH @flints1963 @asoldiersvoice @shawbear76 https://t.co/KChTcH9Ikj
— Kelli Smith (@KelliSmith15) March 20, 2020
😳🤬🤦🏽♀️ As the Coronavirus Approaches, Mexico Looks the Other Way @birdieglad @pannlewis44 @graceslick77 @GDijkhuyzen @haldonahue @veterans_i @DaOGTriple @DLTrunnell @Robin_Volpi @JhwilsH @flints1963 @asoldiersvoice @shawbear76 @MzDivah67 @RK1960 https://t.co/Vj0FMPGfxf
— Kelli Smith (@KelliSmith15) March 26, 2020
😡 @graceslick77 @haldonahue - As soon as I typed out those words, that red Virus ball jumped up on there!!!!!! 👿👎🏽☠️
— Kelli Smith (@KelliSmith15) March 26, 2020
😲🦠 Infant dies after testing positive for coronavirus in Chicago @birdieglad @pannlewis44 @graceslick77 @haldonahue @MarilynT4 @veterans_i @DaOGTriple @DLTrunnell @Robin_Volpi @JhwilsH @flints1963 @asoldiersvoice @shawbear76 @Mahogany1992 @RK1960 https://t.co/0RISRDTCIP
— Kelli Smith (@KelliSmith15) March 29, 2020
🤭🦠🙏🏾 CNN's Chris Cuomo Diagnosed With Coronavirus @birdieglad @pannlewis44 @graceslick77 @GDijkhuyzen @haldonahue @MarilynT4 @veterans_i @DaOGTriple @DLTrunnell @Robin_Volpi @JhwilsH @flints1963 @asoldiersvoice @shawbear76 @Magic367g @RK1960 https://t.co/A245QeLCeE
— Kelli Smith (@KelliSmith15) March 31, 2020
Hannah Szu-Han Wang
PhD student
My research interests include data science, high-dimensional statistics, sustainable interventions and investments, and human well-being