Coronavirus Tweet
This is a R shiny app project
Introduction
Coronavirus disease (COVID-19) is an infectious disease with unprecedentedly extreme contagiousness, which is far beyond SARS or MERS. Its first outbreak was observed at Wuhan, the capital of Hubei province in China, and it is a catastrophe on a global scale. While it is spreading all over the world, the speed or the pattern of how it is transmitted varies by country. There could be factors such as the governments’ reactions that interfere with the spreading speed, but we want to delve into the social media perspective to investigate if it can predict the spread of COVID-19.
The initial thought is that social media is a platform where people discuss things they care about. Regarding COVID-19, there are so many online discussions every day. Thus, we are curious to examine if these discussions have anything to do with the spread of disease. In this application, tweets under the #coronavirus hashtag are used as the proxy for COVID-19 related social media discussions. As for indices of the disease spread, total confirm cases, total test cases, confirm cases per 100 tests, new cases, new deaths, and total deaths are included to let users explore. With the tweets data collected from Twitter API, and coronavirus data from Our World in Data website, we found two ways to account for the variance in the COVID-19 case numbers: one is the topic clusters of the tweets which is shown in the “Tweet Wall” tab, and the other is the frequent words within tweets, which is shown in the “Spread of Covid-19 versus Frequent words in tweets” tab.
Authors: Sukyoung Cho & Hannah Wang
Methods
Methods and code are documented in the Github Repository.
Usage of the App
- Tweet Explore
Please choose the date input first, and then choose a flock that you are intered in. Then you’ll see the visualizations dynamically change. In the “Word Frequency (Summary by flock)” session, it displays the top 15 tweet words that exist within the specified date-flock. In the “Word Frequencey (Summary of the date)” session, it displays the top 15 tweet words on that date (regardless of flocks). The “sentiment distribution” displays with boxplots. The box contains first, second, and third quantiles, and the dots are outliers.
(If nothing displays, please click on any date and flock of interest to trigger the plot to re-render)
- Tweet Wall
Please select a topic and a flock to see the tweet posts that were clustered into the topic. Then the user will see the correspondent glm summary table for that flock. Each as.matrix(z)1, 2, 3… represents a topic, i.e. as.matrix(z)1 is topic 1, as.matrix(z)2 is topic 2. The y in the model represents the log transformation of the total confirm case. The tweets and summary table are constructed with the data across 60 days, i.e., the unit of analysis is a day. There may be some duplicate tweets with different time stamp, or because the tweets' status ids are different, they are still all included. Or if the tweet posts are missing, it may mean that they were deleted, so the html widget could not obtain the post.
- Spread of Covid-19 v.s. frequent words
Under this tab, users are able to see plenty of graphics. On the top-left side, the graph displays the cumulative number of confirmed cases and the cumulative number of tests performed along the timeline, which serves to represent the trend of the pandemic. The graph next to it shows the change of confirmed case per 100 tests with time, which can be a good indicator for the spread of Covid-19. On the bottom-right and bottom-center, users are able to explore the graphs with variables that they might be interested in. Facet plot is for users who are interested in all attributes and want to see everything at a glance. The user can choose the word to see its relationship with each type of case numbers. Each dot represents a day, and all case numbers are log transformed. Next to it is the “Single plot”, it allows users to zoom in a single word(predictor) and a single case type(dependent variable), and the case numbers in the zoomed-in single plot does not take log transformation. On the bottom-right, users are able to explore the statistical model to estimate the predictions based on the linear model. Using a check box, readers can choose predictors and the dependent variable they want to predict. The words used as predictors are the most frequent words that appeared in more than 40 days. We took a log for Total_confirm and Total_test variables to make them less leveraging, as they are increasing exponentially.
Results
Here, we will present an example result for each tab.
- Tweet Explore
Here is an example that we choose February 1st as date, and flocks of interests are “liberals”, “media”, and “academia”. The top row shows the top 15 words for each flock on that date, and the bottom left shows the summary of top words' frequencies for all 6 flocks on that date. As is shown in the plots, there are several words that make the list for all flocks, such as “outbreak” and “wuhan”. However, there are also flock-specific words, for example, “sars” and “misinformation” only occurs in media flock. The reason may be that they are in charge of delivering information, and compare covid-19 with sars to let the audience be more aware of the disease. The bottom right is the sentiment distribution for the flocks we chose. For the three flocks we chose, 75% of the tweets' sentiments are below 0, and tweets from academia seemed to have a rather centralized sentimental distirubtion.
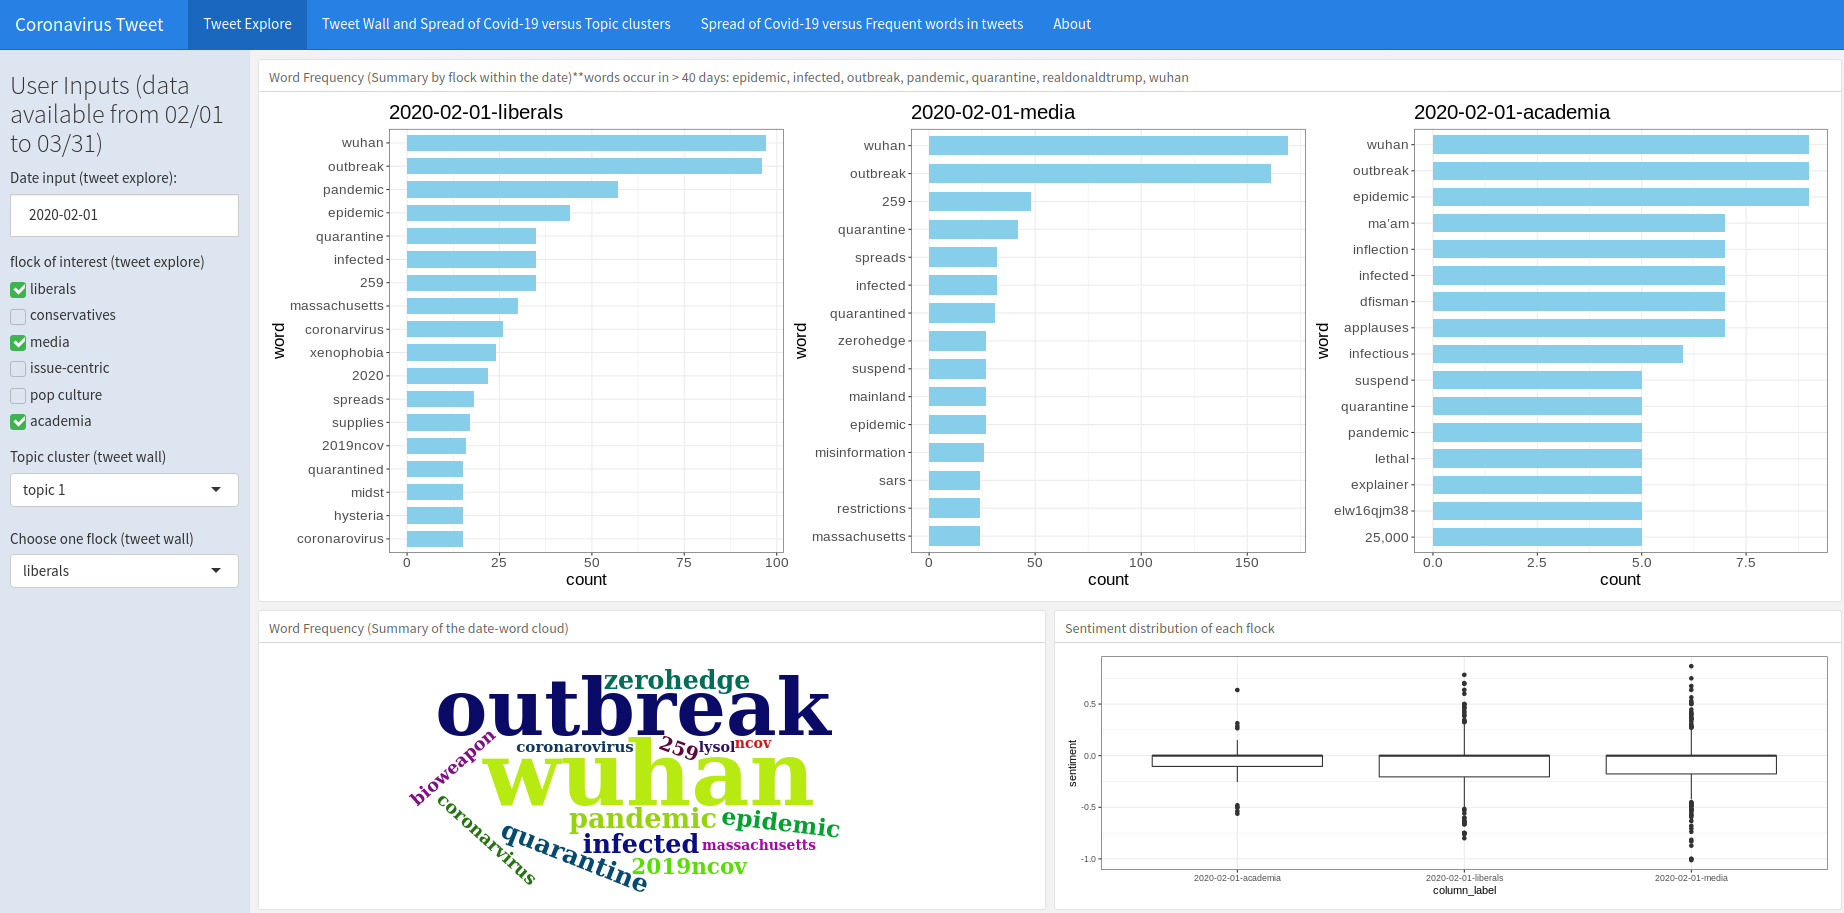 Fig. 1: Tweet explore example
- Tweet Wall
Here is an example that we choose topic 4 of liberals. If you scroll through, it’s mainly talking about how Trump deals with Covid-19. In the summary table, it is shown that, for tweets within liberals flock, topic 1-5, topic 7-18, topic 20-27 and topic 30 are all siginificant for explaining the variance in log(total confirm case numbers). Looking through some of the significant topics, for example, topic 10 seems to be talking about the spread of Covid-19 within U.S. Topic 11 seems to be talking about WHO.
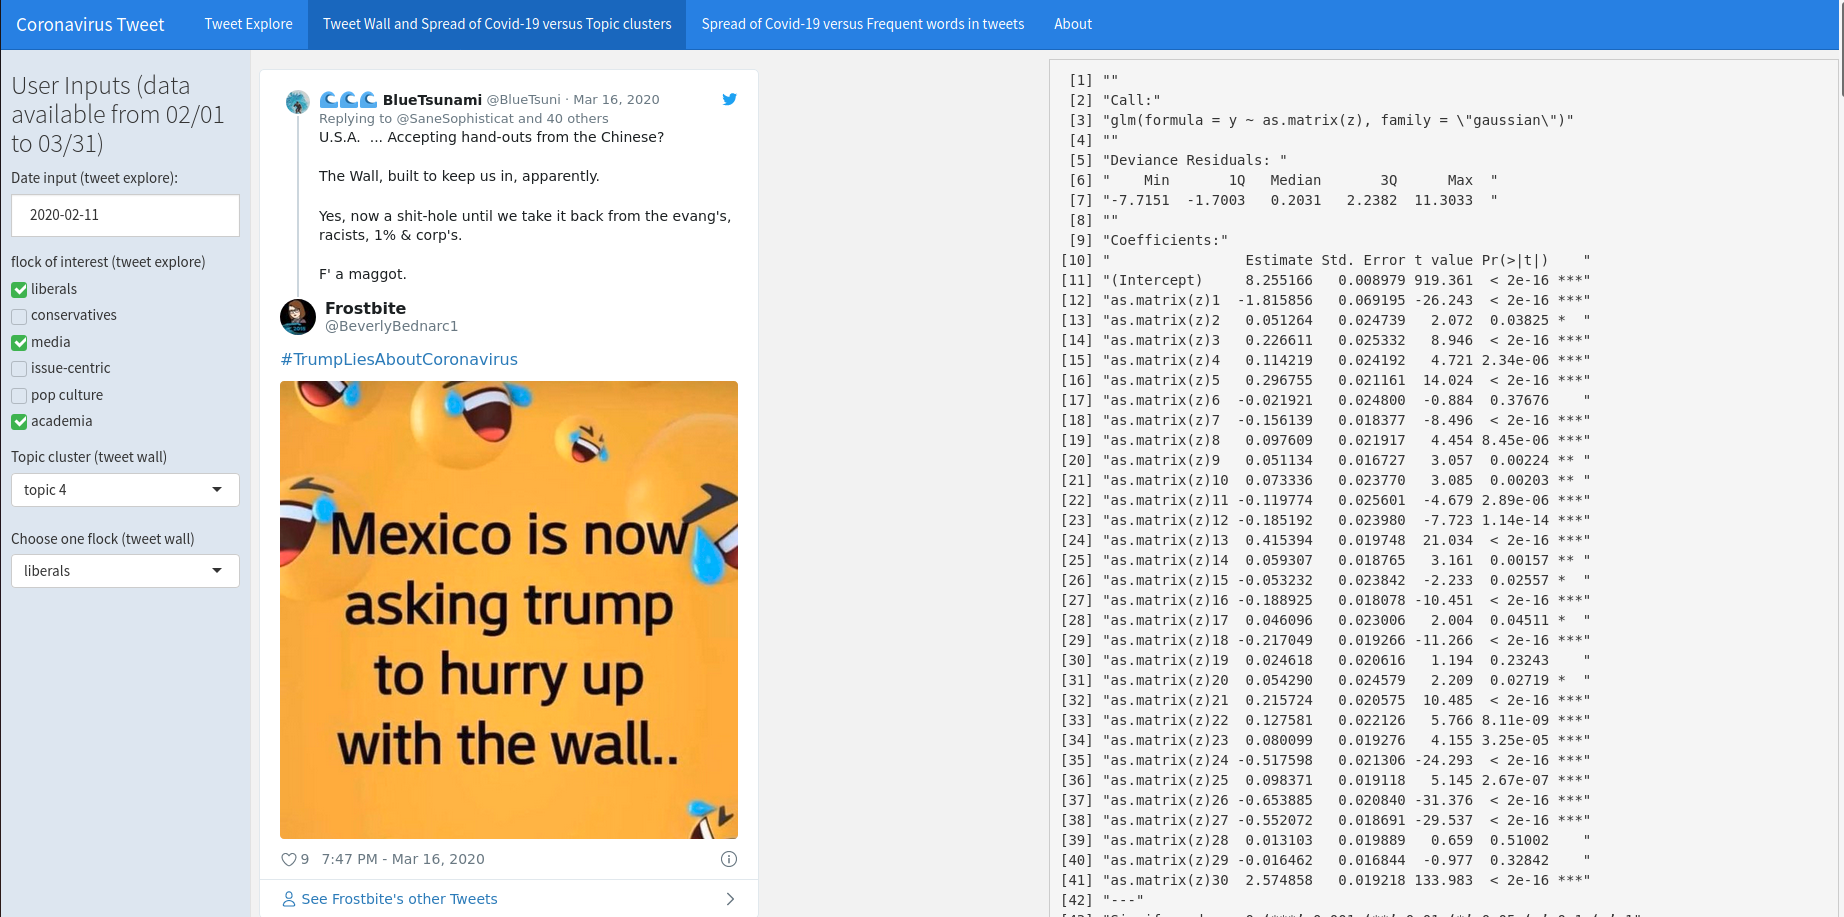 Fig. 2: Tweet wall example
- Spread of Covid-19 v.s. frequent words
For “facet plot”, we choose “epidemic” as the x. The x axis represents the count of the word’s occurence, y represents log transformation of the case numbers, and each dot is a date. Overall, while the frequency of “epidemic” increases, the log(total_confirm), log(new_cases), and log(total_deaths) increases as well. For the “single plot”, we choose infected as the predictor, and total_confirm as response. However, because in the end of March, the case numbers started to increase exponeentially, which makes other points look close to zero, resulting in the no-trend plot. This verify the fact that for total confirm case numbers, we may need to take a log transformation if we want to construct a linear model. For the “Linear model” session, we choose epidemic, realdonaldtrump, and wuhan as predictors, and log(total_confirm) as response. According to the summary table, epidemic and realdonaldtrump are significant-positvie correlated with log(total_confirm), and according to the adjusted R-squared, the predictors altogether account for around 85% of the variance in log(total_confirm).
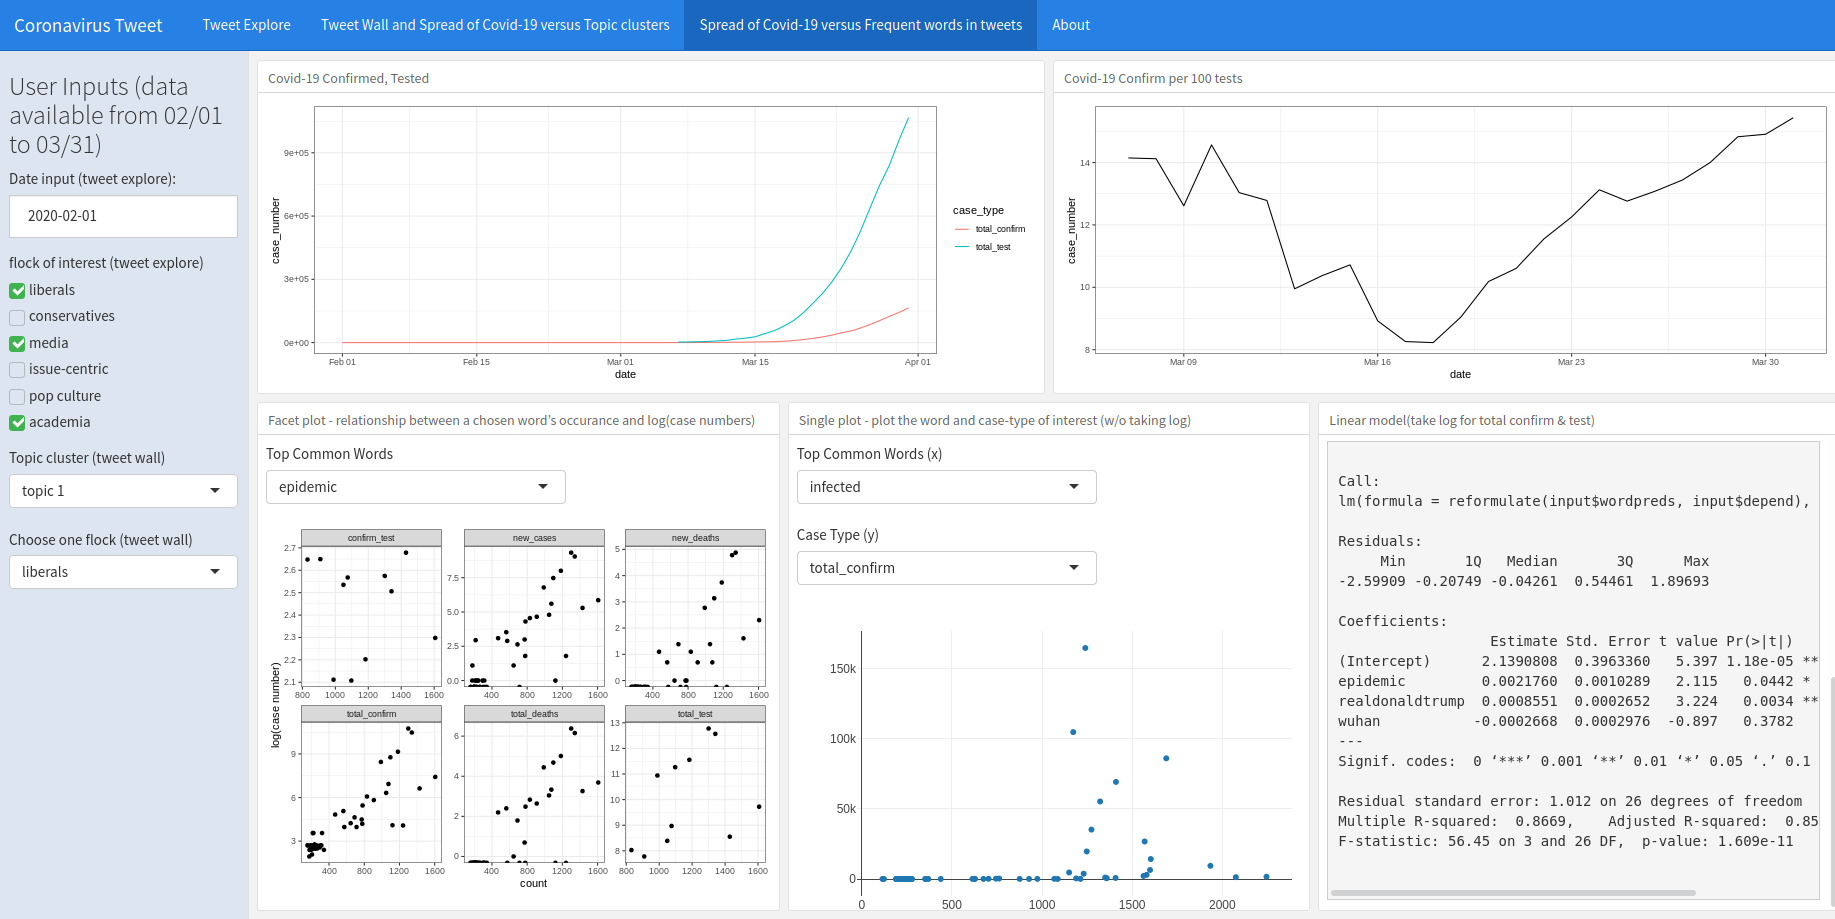 Fig. 3: Spread of Covid-19 v.s. Frequent words in tweets example
Conclusions
The main goal of the app was showing users how tweet words and posts are related with the trend of Covid-19’s spread. From our test examples, it is shown that the tweets, both in word token level and in topic level can significantly explain the variance in covid-19 case numbers, and the most obvious trend exists when the dependent variable is log transformation of total confirmed cases. The limitation of the app is that, so far we only included data until March 31st, but there are many more cases after April, which can be interesting to explore as well. Moreover, regarding the tweet posts, there are some tweets that contain duplicate contents but different status ids, and we did not exclude these duplicates. For future work, it may be more interesting to analyze only on the unique posts.
Hannah Szu-Han Wang
PhD student
My research interests include data science, high-dimensional statistics, sustainable interventions and investments, and human well-being